


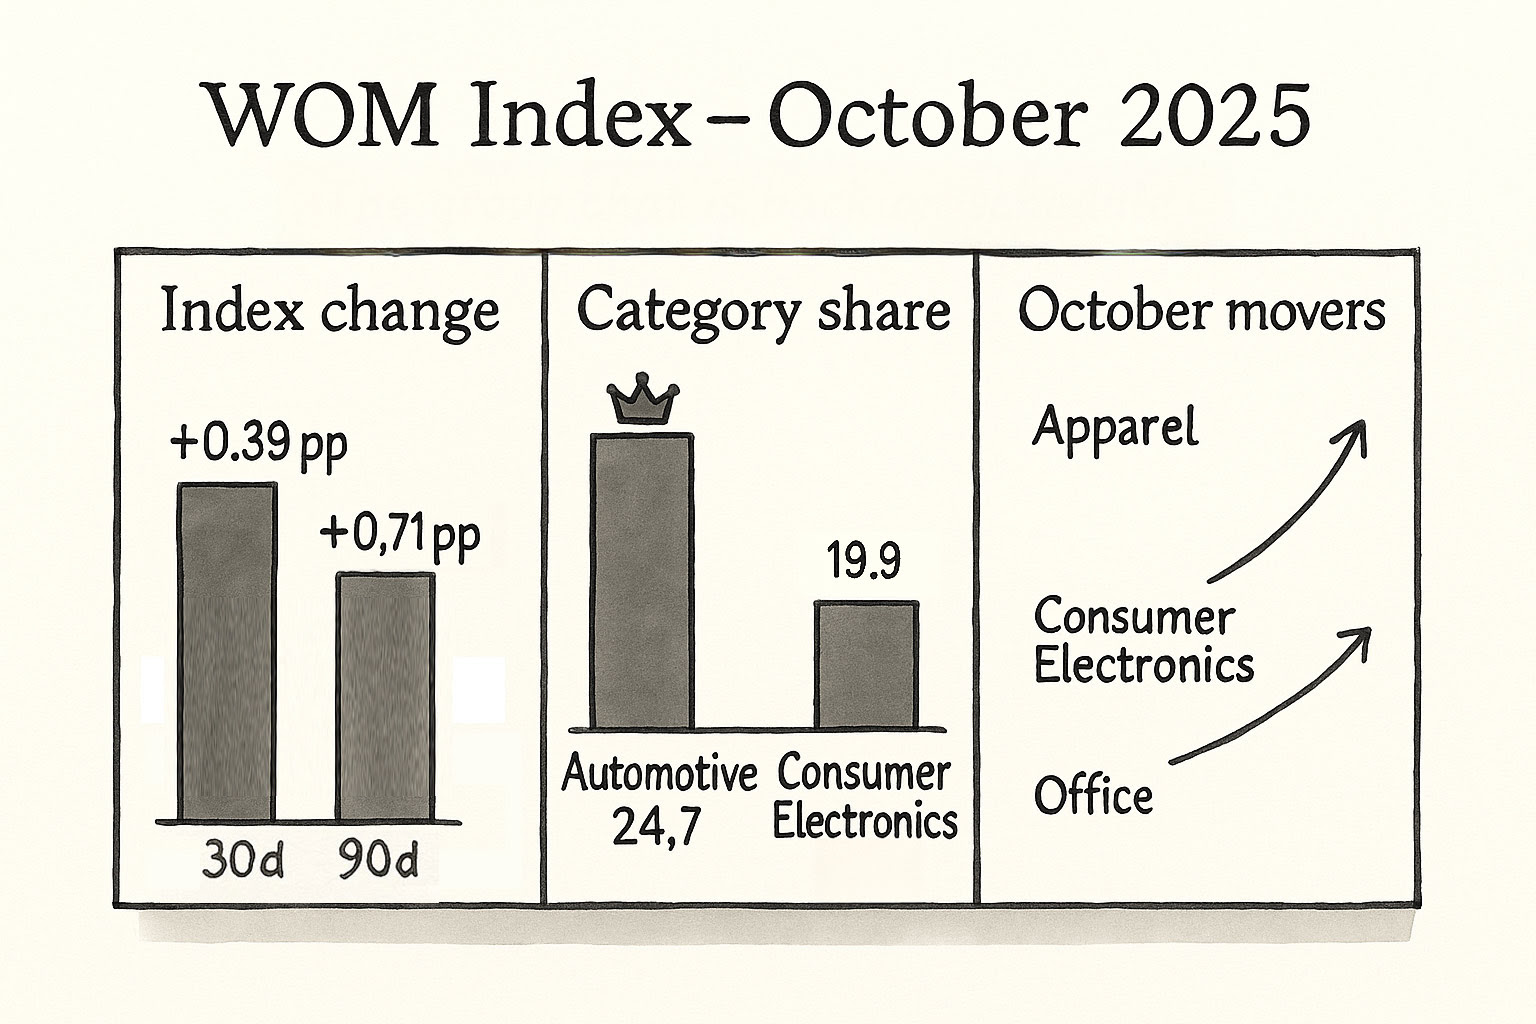
Year-over-year WOM is down 0.47 percentage points, but 19.29% of all consumers cited WOM as their key purchase driver, up 0.39 percentage points from the previous month and 0.71 percentage points from July, indicating that consumer behaviors (and chatter) are ramping up according to plan. Let’s see how other categories are tracking:
🚗 Automotive: 24.71%
👗 Apparel and Accessories: 21.70% (⬆️ over September)
📱 Consumer Electronics: 19.91% (⬇️ over September)
🏈 Sporting Goods: 18.78%
🩷 Specialty: 17.57%
💊 Food and Drug: 17.55%
🛋️ Housewares and Home: 16.89%
🧴 Health and Beauty: 15.82%
🗂️ Office: 10.12%
As Fairing CEO Matt Bahr noted in a recent LinkedIn Live, apparel spend tends to ramp up in Q4, as wardrobes change with the seasons and folks pick up new fashions for holiday parties and New Year’s Eve soirees. Conversely, the slight decrease seen in electronics aligns with consumer pullback as they await holiday deals and sales.
Office WOM popped above 10%, which is ironically better than the back-to-school season’s peak. But Health and Beauty is still not performing its best. Hopefully, brands will get a WOM glow-up going into BFCM.